No mobile template selected for this menu item.
Comprehensive care for Austin homes and small multifamily investment properties.
Strategic oversight for retail, office, and mixed use commercial properties.
Expert condo management services for Austin owners and investors.

Comprehensive care for Austin homes and small multifamily investment properties.
Strategic oversight for retail, office, and mixed use commercial properties.
Expert condo management services for Austin owners and investors.
Quickly and securely pay your rent through our 24/7 online resident portal.
Submit and track maintenance requests easily to keep your home in top shape.
Complete your rental application online for your new home.

Quickly and securely pay your rent through our 24/7 online resident portal.
Submit and track maintenance requests easily to keep your home in top shape.
Complete your rental application online for your new home.
Explore the benefits of our partnership ecosystem.
Centralized resources and documents for our partners.

Explore the benefits of our partnership ecosystem.
Centralized resources and documents for our partners.
Austin's premier property management partner since 2006.
From humble beginnings to managing hundreds of properties.

Austin's premier property management partner since 2006.
From humble beginnings to managing hundreds of properties.
Insights, tips, and best practices for Austin real estate investors and owners.
Check out our central hub for property management tools and insights
Watch on-demand tutorials, Q&A sessions, and educational content.
Insights, tips, and best practices for Austin real estate investors and owners.
Check out our central hub for property management tools and insights
Watch on-demand tutorials, Q&A sessions, and educational content.
Book a time directly with our property management experts to discuss your needs.
Ready to move forward? Begin your onboarding process now.
Get a free, data-driven report on your property's rental potential.
Have a general question? Drop us a message anytime and we'll help you out.
Book a time directly with our property management experts to discuss your needs.
Ready to move forward? Begin your onboarding process now.
Get a free, data-driven report on your property's rental potential.
Have a general question? Drop us a message anytime and we'll help you out.

No Data Found
Property condition and rental price continue to be leading factors that affect leasing stats, that’s why 1836PM has continually improved our level of service to potential residents, including:
No Data Found
When onboarding a new rental property into our portfolio, we follow a tried and true procedure to fulfill legal and compliance mandates, make-ready projects, and competitive rental rate analysis. These tasks are non-negotiable, and the timeline largely depends on the condition in which we receive the property. Keep in mind that every new property we receive is different, so this data is an average of our entire portfolio of properties.
Watch to learn more about the Facts About Preparing a Rental Property for Market here.
No Data Found
Condition and price, as always, determine DOM and the number of showings it will take to lease. 1836PM has been executing and perfecting remote showings for years, and now we efficiently execute remote move-ins with our leading internal and external software and systems.
Maintenance matters! We cannot state this emphatically enough. Proper maintenance ensures the longevity of your property and helps avoid costly repairs down the road. It’s also a significant sign to your residents that you genuinely care about their home—remember, we want them to renew their lease!
1836PM answers maintenance calls promptly and oversees repairs as quickly as possible. Our dedication to efficiency ensures that residents continue to report issues as they arise—mitigating the chance of surprise big-ticket fixes in the future. We maintain open lines of communication with our residents 24/7, so we never miss those important maintenance needs for every single property in our portfolio.
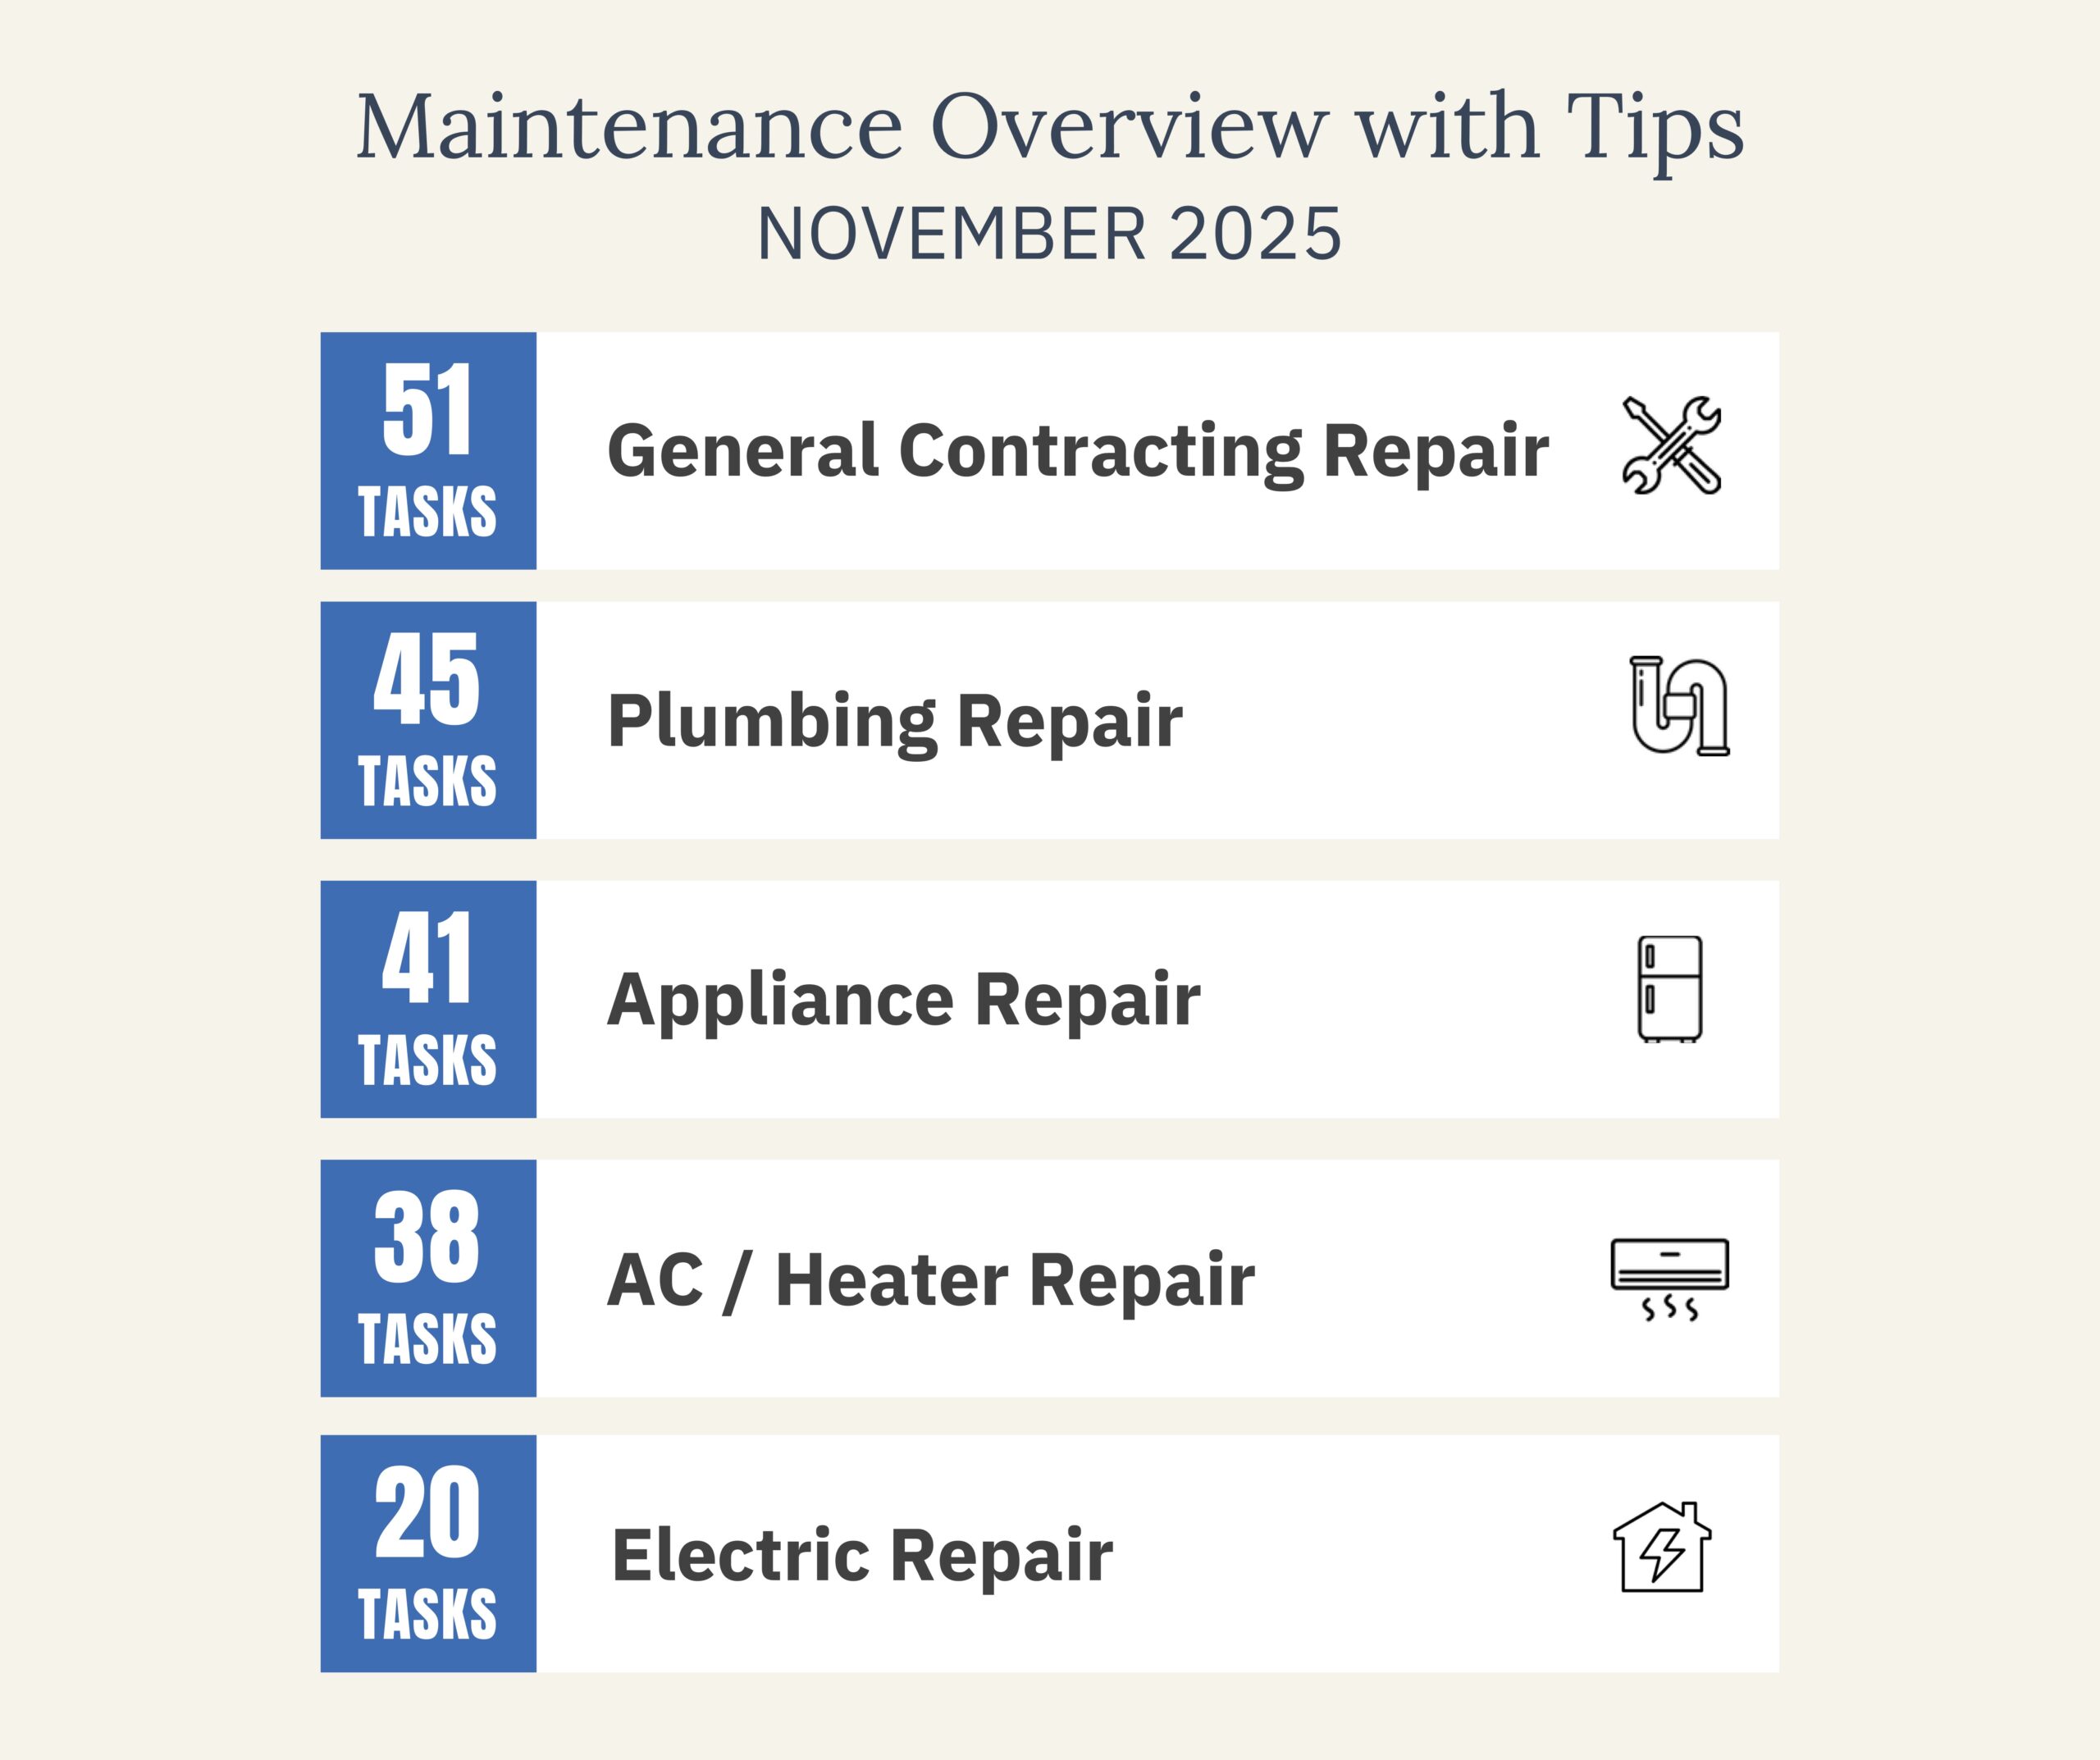
Please look at the top maintenance issues our team of professional handymen tackled just last month!
No one likes to hear the word eviction. But nonetheless, sometimes it has to be done. Fortunately, our stringent application approval process mixed with top notch resident communication has allowed us to mitigate the need for regular evictions. We pride ourselves on placing residents in our properties that are not only the best fit, but are also financially stable.
However, when the need arises, our investors can rest assured that we will handle the situation every step of the way. This includes, but not limited to, posting the appropriate notices legally required by local and state laws, periodic occupancy checks, filing with the appropriate precinct courthouses, and attending the judgment hearing with a professional eviction service provider for additional support.
Austin Texas Eviction Tracking
View detailed information about eviction stats in Austin, Texas collected via Princeton University EvictionLab.org.
Tracking time on maintenance and repairs demonstrates time gained for the investor! We do the work for you. Out of all maintenance calls requested per unit per month, 78% of those requests are actionable. Meaning we call our trusted vendor to step-in, troubleshoot and repair.
Excellence in communication is delivered via our basic tenets of being honest and direct, performance-oriented, and emotionally engaged. We invest a lot of time ensuring a robust communication process.
*Data per unit per month.

Time spent on general email correspondence per unit per month (to residents, owners, vendors, applicants, billing, legal, etc.)
*Data based on if each email received took 1 minute to reviewand each email sent took 2 minutes to write.

Now let’s add maintenance email correspondence to the mix…
*Data based on time spent providing general email correspondence + maintenance troubleshooting, scheduling, billing and payments.